1. The Formula Behind Cost Per Lead
If you want to know how to reduce cost per lead, start by breaking it into the numbers that create it. Cost per lead is not one thing you can tweak. It is the result of three rates multiplied together:
Cost per lead = cost per 1,000 impressions ÷ (1,000 × click-through rate × landing page conversion rate)
Say you pay $20 per 1,000 impressions, 1% of viewers click and 10% of clickers become leads. That is 1 lead per 1,000 impressions, so $20 per lead. Double click-through to 2% and the same budget gives you $10 leads. Double landing page conversion as well and you are at $5. You control click-through rate (with offer and creative) and conversion rate (with page and form) far more than you control the auction price. If you need the definition first, our cost per lead glossary entry covers it, and the cost per lead calculator lets you model your own numbers.
2. What Real Campaigns Achieved
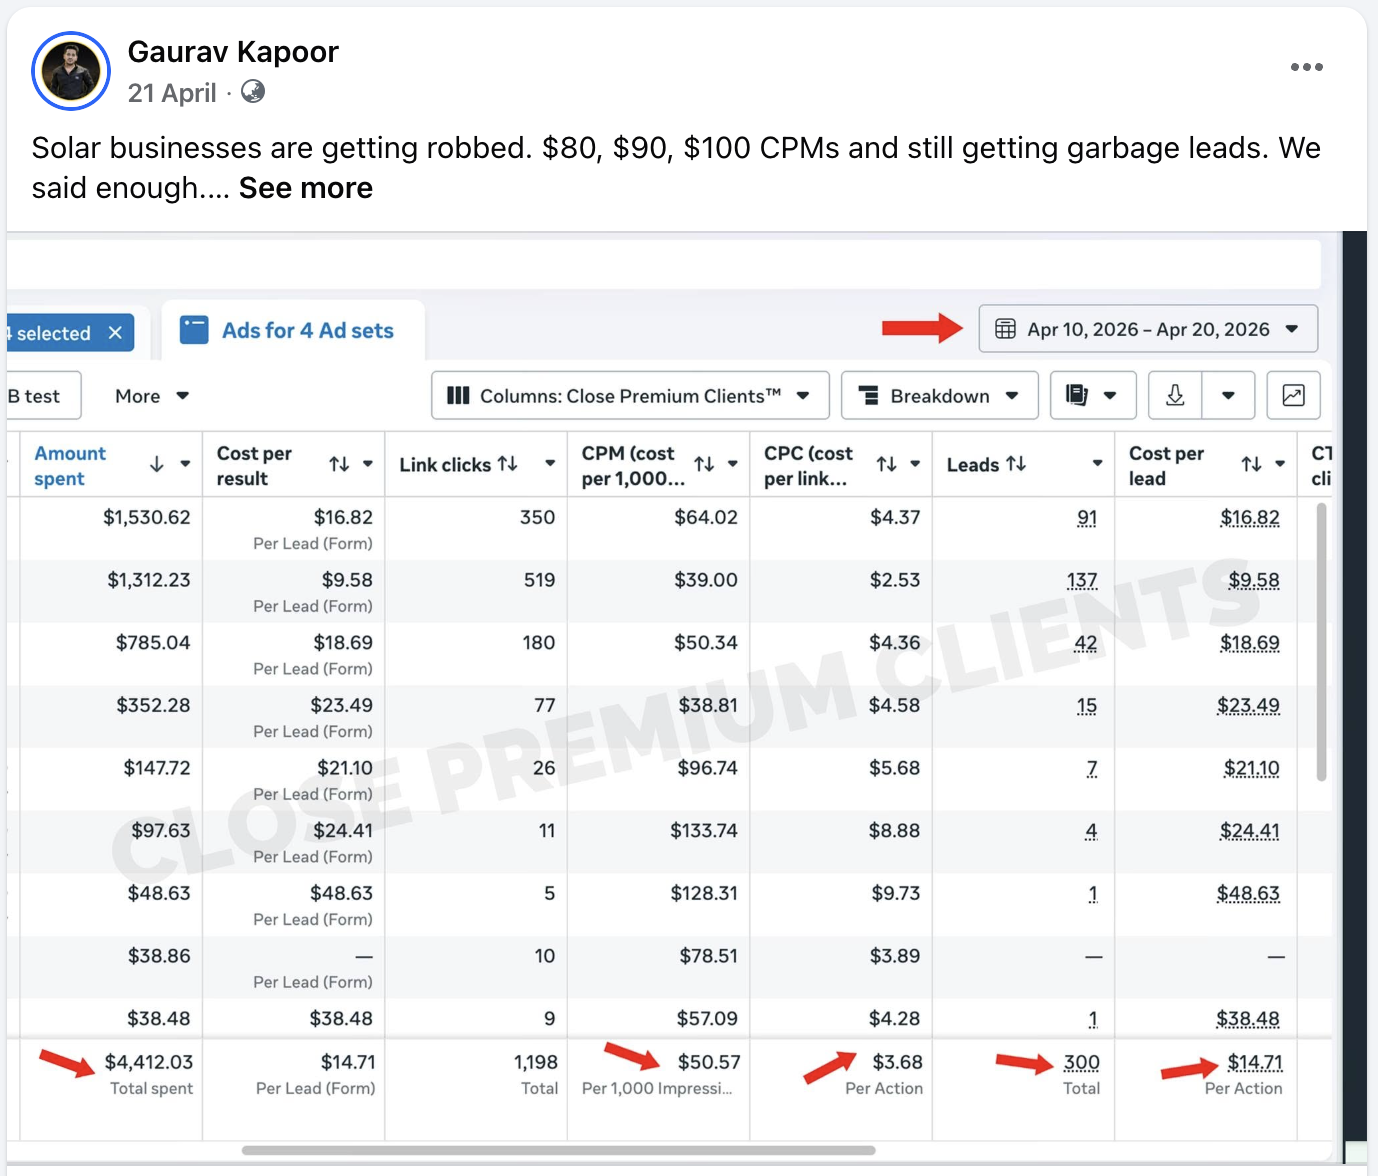
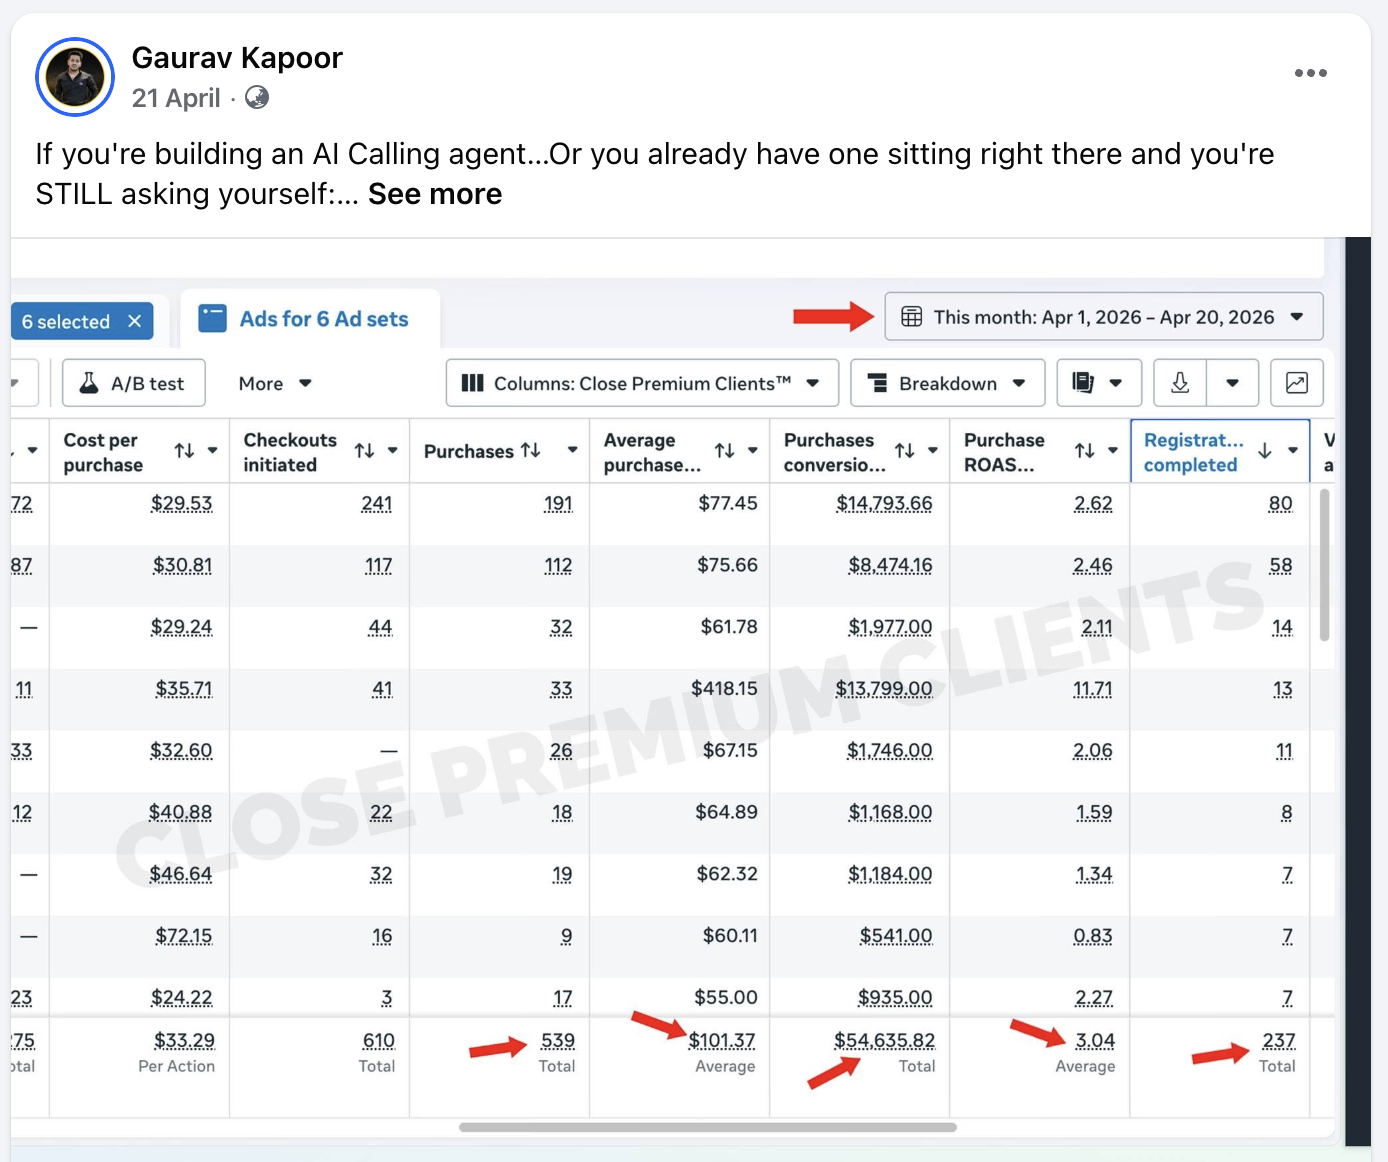
Benchmarks vary widely by industry, location, season and how strict the qualification is. These are documented results from client ad accounts:
| Industry | Leads | Cost per lead |
|---|---|---|
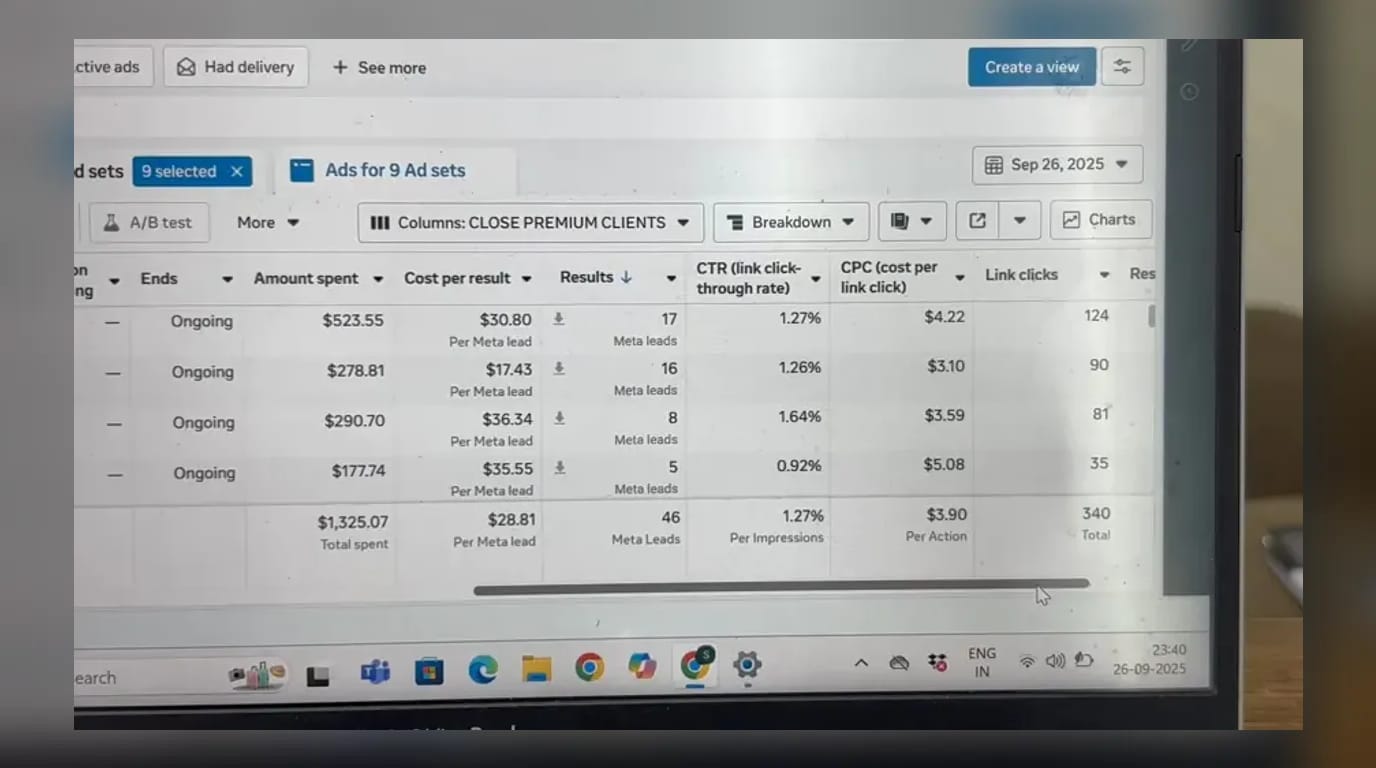
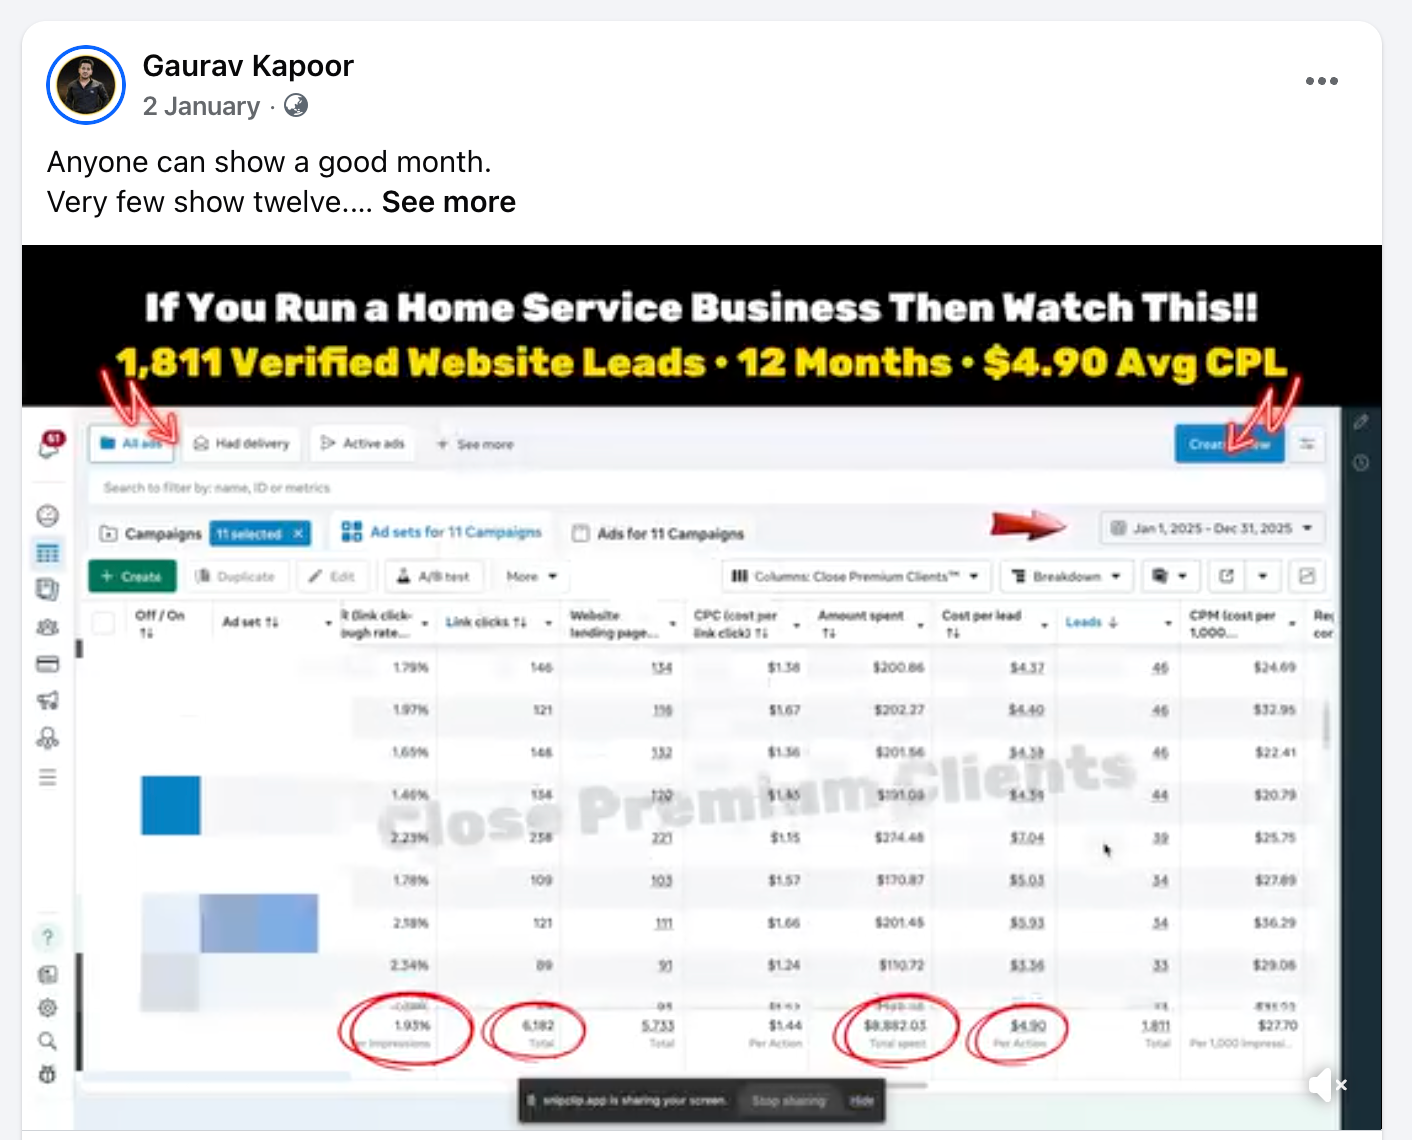
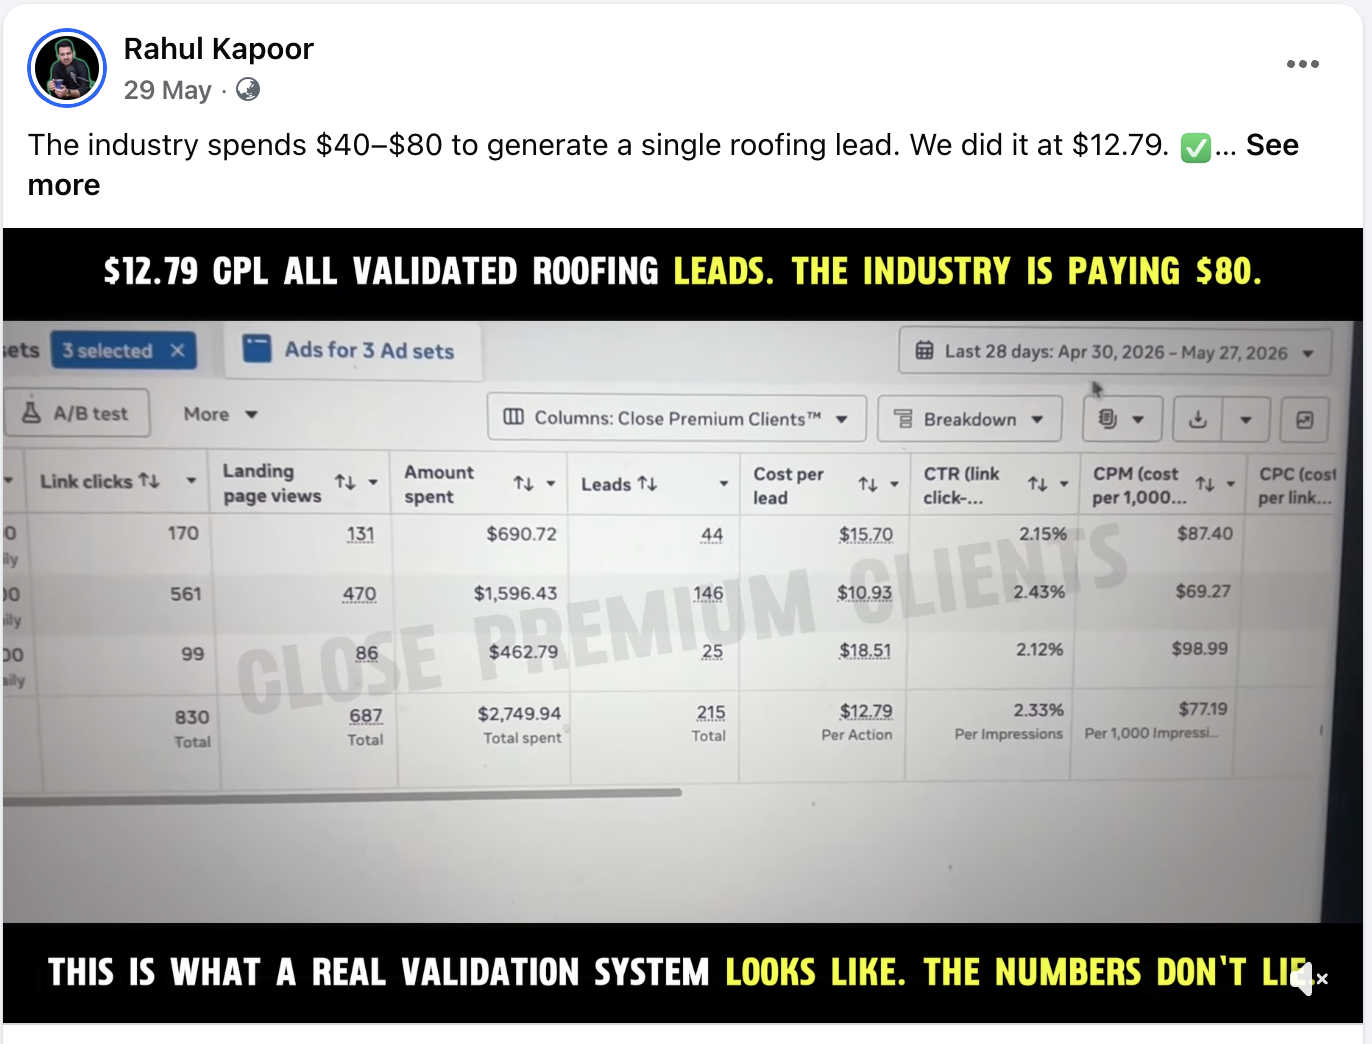
| Roofing | 537 (on $2,292) | $4.27 |
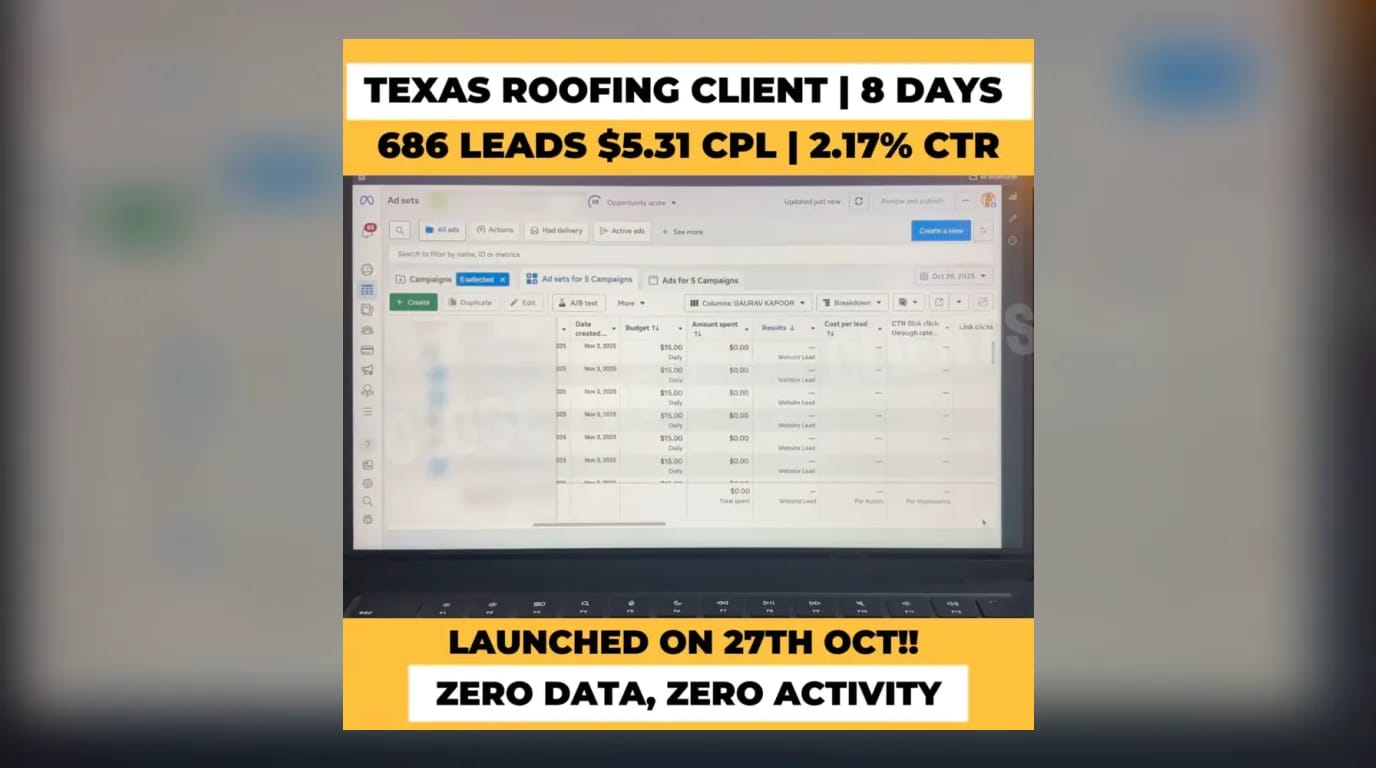
| Roofing | 686 | $5.31 |
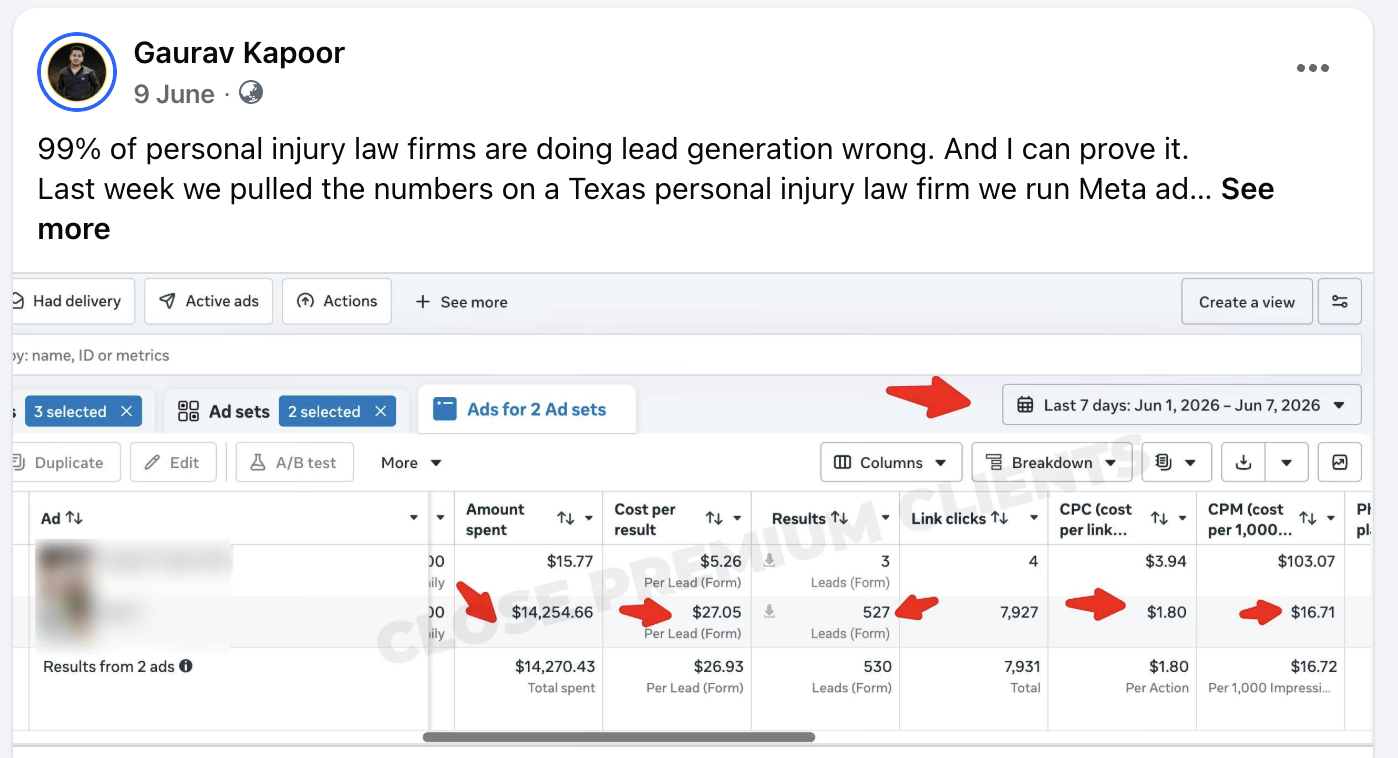
| MVA personal injury | 6,275 (on $27,467.70) | $4.38 |
| Mortgage | 142 (on $612) | $4.31 |
| HVAC | 326 | $5.57 |
| Coaching | 398 (on $2,190.72) | $5.50 |
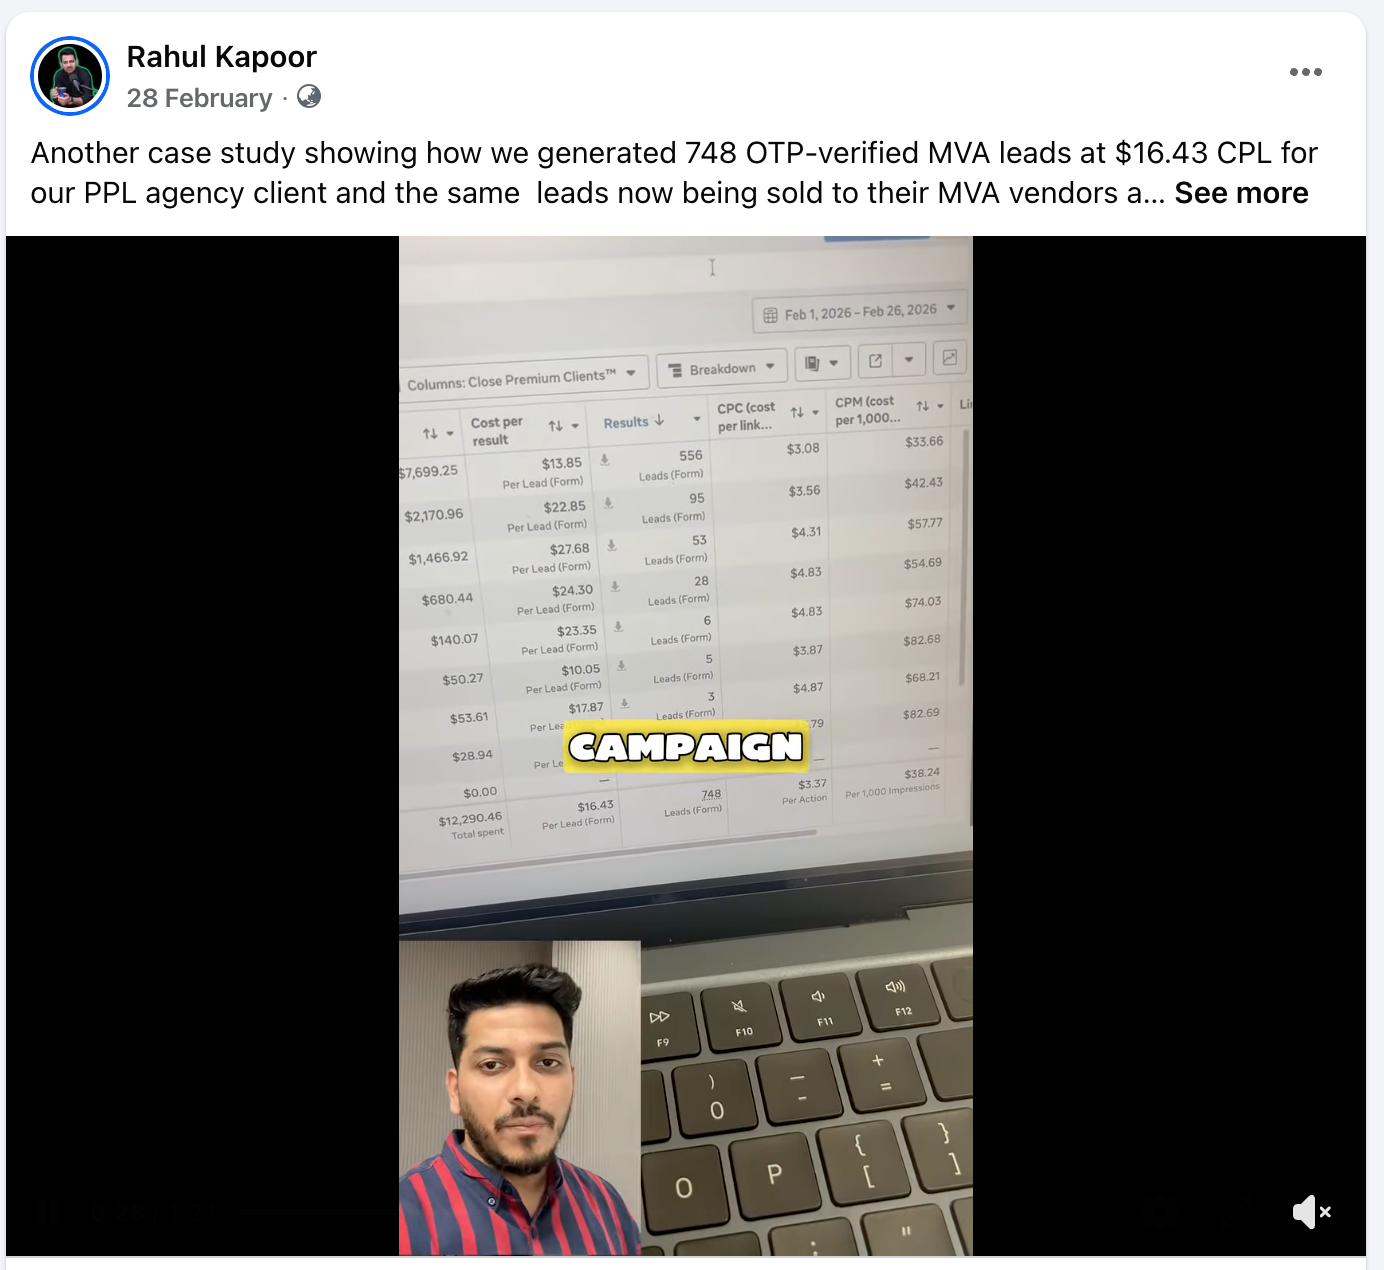
| Agency | 1,890 (on $12,707.55) | $6.72 |
| Final expense insurance | 2,440 (on $19,011.31) | $7.79 |
Higher figures exist in the same accounts, such as roofing at $24 on a $24,902 budget, because cost per lead usually rises as you scale spend and exhaust the cheapest audiences. That is normal. The goal is not the lowest possible number, it is the lowest number that still produces customers at a profit. The full set of roofing figures and the funnel behind them are in our roofing cost-per-lead playbook.
3. Diagnose Which Number Is Broken
Before you change anything, find out which part of the formula is dragging cost per lead up. Pull the last 14 to 30 days for each campaign and compare three numbers against that campaign's own best period:
| What you see | Likely cause | Where to start |
|---|---|---|
| Cost per 1,000 impressions up, click-through steady | Auction pressure, season, narrow audience | Broaden targeting, consolidate ad sets |
| Click-through falling, frequency rising | Creative fatigue | New hooks and formats (fix 2) |
| Click-through low from launch | Weak offer or unclear promise | Rewrite the offer (fix 1) |
| Click-through fine, landing conversion low | Page, form or message mismatch | Fixes 3 to 5 |
| Leads in CRM higher than leads in Ads Manager | Tracking gaps | Server-side events (fix 6) |
Fixing the wrong number wastes weeks. A new landing page will not help if the real problem is that nobody clicks the ad, and fresh creative will not help if visitors leave a slow page before it loads.
4. Fix 1: Change the Offer
The offer is the single biggest lever because it moves click-through and conversion at the same time. "Contact us for a quote" asks for effort and promises nothing. Compare it with offers that lower risk and name a specific outcome:
- Roofing: "Free roof inspection after the storm, quote in 24 hours, no sales visit."
- Mortgage: "See your new monthly payment in 5 minutes, no credit check."
- Med spa: a first-visit package with a clear price instead of "book a consultation".
- Coaching: a specific diagnostic or plan instead of a generic "strategy call".
In one coaching account, an offer tweak alone lifted click-through to the 4% to 6% range (see the case). Write three offer variations before you touch targeting or bids, and test them against each other with the same creative style.
5. Fixes 2 and 3: Creative and Message Match
Fix 2: Refresh creative on a schedule. Creative fatigue is the most common reason cost per lead creeps up. As frequency rises, click-through falls and cost per lead follows. Run three to five creatives per ad set, retire anything whose click-through has dropped well below its first-week level, and keep a pipeline of new hooks. Native-looking images and simple talking-head videos often beat polished brand ads. In a live roofing ads audit, the strongest creatives hit an 18% click-through rate (see the audit), which shows how much room creative alone can open up.
Fix 3: Match the landing page to the ad. If the ad promises a free inspection after a hailstorm, the page headline should say exactly that. Every mismatch between ad and page costs conversion rate, and conversion rate is half of the formula. Build one page variant per main ad angle rather than sending every ad to the same generic page.
6. Fixes 4 and 5: Landing Page and Form
Fix 4: Make the page fast and focused. Paid social traffic arrives on phones, often on mobile data. Compress images, remove heavy scripts and chat widgets, cut the navigation menu and put the first form step on the first screen. Each second of load time loses visitors you already paid for.
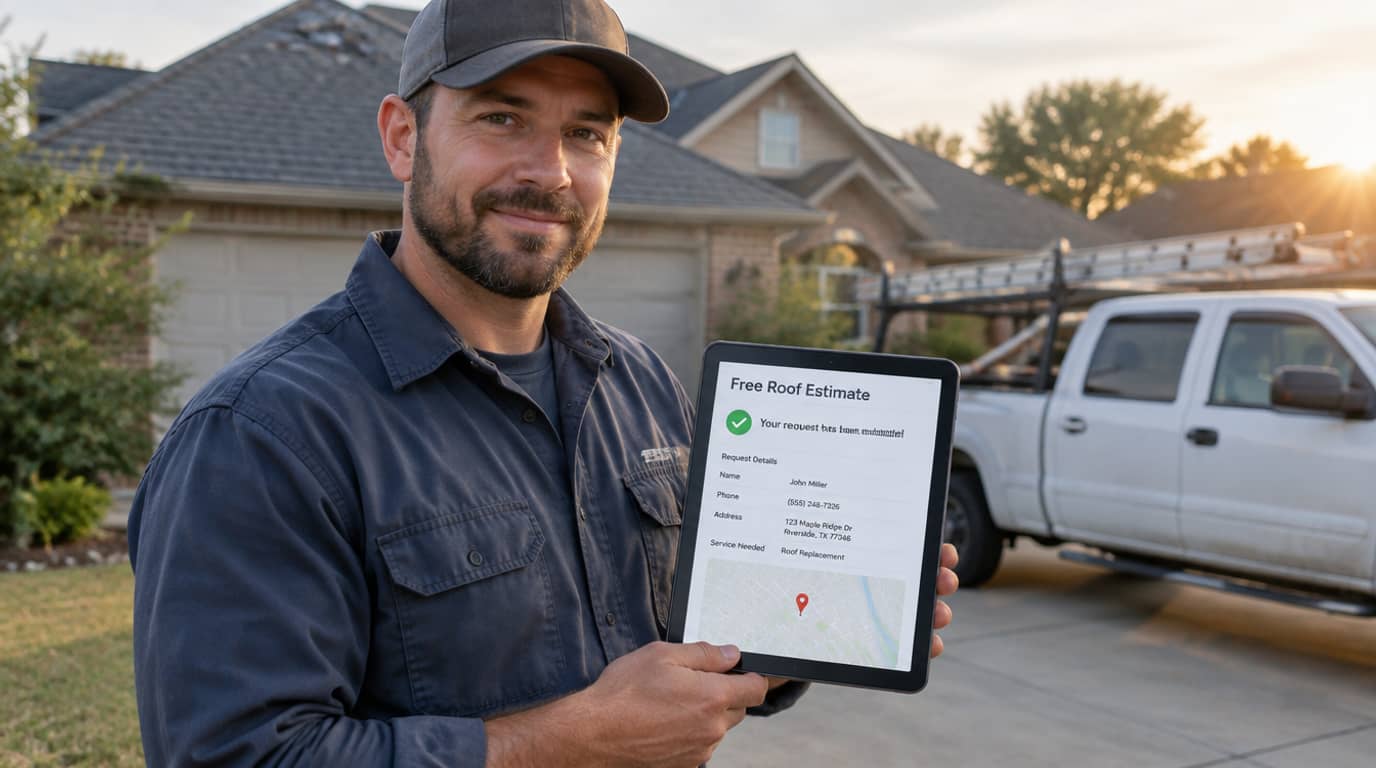
Fix 5: Replace the contact form with a short multi-step form. Three to six easy multiple-choice questions, one per screen, then contact details last. Small answers build commitment, so more people finish than on one long form, and the answers qualify the lead for sales. This is the structure behind our quiz funnels and the quote estimators in our roofing and home services builds. If you are weighing this against Meta's instant forms, read Facebook lead ads vs funnels first: instant forms often post a lower cost per lead and a higher cost per customer.
7. Fixes 6 and 7: Tracking, Signal and Targeting
Fix 6: Fix tracking before you trust the number. If your pixel misses conversions, your reported cost per lead is too high and the ad platform is optimizing on incomplete data. Server-side tracking closes the gap: on our builds, the Meta Conversions API recovered 31% more events than the pixel alone. More events means more signal, and more signal usually means the algorithm finds converters more cheaply over the following weeks.
Fix 7: Give the algorithm room and the right goal. With good signal, broader targeting often beats narrow interest stacks, because the system can find pockets of cheap converters you would never have guessed. Consolidate small ad sets so each exits learning faster, avoid editing campaigns daily, and optimize for the lead event, or better, a qualified lead or booked call event sent back from your CRM. Our Conversions API guide shows how to send those downstream events.
8. What Happens to Cost Per Lead When You Scale
Cost per lead almost always rises as budget rises. The first dollars reach the people most likely to convert; each extra dollar reaches people a little less likely. Our own accounts reflect this: larger-budget campaigns in the same industries that produced $4 to $6 leads tend to sit higher, such as 1,068 roofing leads at $17.40 and 630 HVAC leads at $23.09.
That is not failure. What matters is whether the marginal lead is still profitable. To keep the rise slow:
- Increase budget in steps of roughly 20% to 30% every few days rather than doubling overnight.
- Add new creative angles as you scale, because one winning ad cannot carry a much larger audience for long.
- Expand geography or offers instead of squeezing the same small audience harder.
- Set a ceiling based on your close rate and job value, and scale until the marginal cost per customer hits it.
9. Fix 8: Protect Quality While You Cut Cost
The easiest way to reduce cost per lead is also the most dangerous: remove every qualifying question and make submitting effortless. Cost per lead drops. Booked calls, show rate and sales drop further. Guard against it with three rules:
- Keep the filters that matter. Two or three qualifying questions and OTP phone verification cost a little conversion and save your team hours of calling fake or unqualified leads. Several of the verified campaigns above still landed between $4 and $6 per lead.
- Judge on cost per outcome. The MVA firm in our $388,000 revenue case paid $18.94 per verified lead, far above the cheapest figures in the table, and returned 19.09x on $20,324 of ad spend. A cheap lead nobody can sign is the expensive one.
- Follow up inside a minute. Lead cost only matters if the lead becomes a conversation. Across 60+ speed-to-lead deployments, 84% of leads were reached inside the first minute and lead-to-booking rose 2.4x. That effectively cuts your cost per booked call by more than half without touching the ads; see our speed-to-lead service.
Track cost per lead, cost per booked call and cost per customer side by side every week, using a sheet like our funnel KPI dashboard template. If you would like us to audit your offer, creative, page and tracking against these eight fixes, book a strategy call. Our funnel builds go live in 5 to 10 business days.
Results from this playbook
Verified client results built on the system in this article, with the numbers from the ad account and CRM.
- 537Leads generatedRoofing Case Study: 537 Leads at $4.27 CPL
- 1,024Leads generatedRoofing Case Study: 1,024 Leads at $24 CPL
- 55Leads generatedHVAC Case Study: 55 Leads at $11.02 CPL
- 326Leads generatedHVAC Case Study: 326 Leads at $5.57 CPL
All roofing lead generation case studies · All HVAC lead generation case studies
Frequently Asked Questions
What is the fastest way to reduce cost per lead?
Usually the offer. A more specific, lower-risk offer raises click-through and landing page conversion at the same time, and both cut cost per lead directly. After that, rewrite the first screen of the landing page to match the ad, and replace a long contact form with a short multi-step form. Targeting changes rarely move it as much.
Does a lower cost per lead always mean better results?
No. Removing qualifying questions, switching to prefilled instant forms or targeting broad giveaway-style offers can halve cost per lead while booked calls and sales fall. Always track cost per booked appointment and cost per customer next to cost per lead, and only keep changes that improve those downstream numbers.
Why is my cost per lead going up?
Common causes are creative fatigue, a seasonal rise in ad auction prices, a broken pixel or form that undercounts leads, a slower landing page, or an offer competitors have copied. Check tracking first, then frequency and click-through rate on your ads, then landing page conversion rate, so you fix the actual cause.
How long does it take to lower cost per lead?
Creative and offer tests show direction within one to two weeks at a reasonable budget. Landing page and form changes need enough conversions per variant to trust, often two to four weeks. Tracking improvements such as the Conversions API pay off gradually as the ad platform learns from better signal over the following weeks.
Do OTP verification and qualifying questions raise cost per lead?
They can raise it slightly, because some people abandon at the extra step. In exchange, every lead has a real, reachable phone number and meets your basic criteria, so contact and booking rates rise. Several of our verified campaigns still landed between $4 and $6 per lead, so quality and low cost are not opposites.
What tools help me track and reduce cost per lead?
You need accurate conversion tracking, ideally pixel plus server-side Conversions API, a CRM that records each lead's source and outcome, and a simple calculator or dashboard. Our cost per lead calculator works out your current figure and shows how changes to click-through and conversion rate would move it.

Gaurav Kapoor
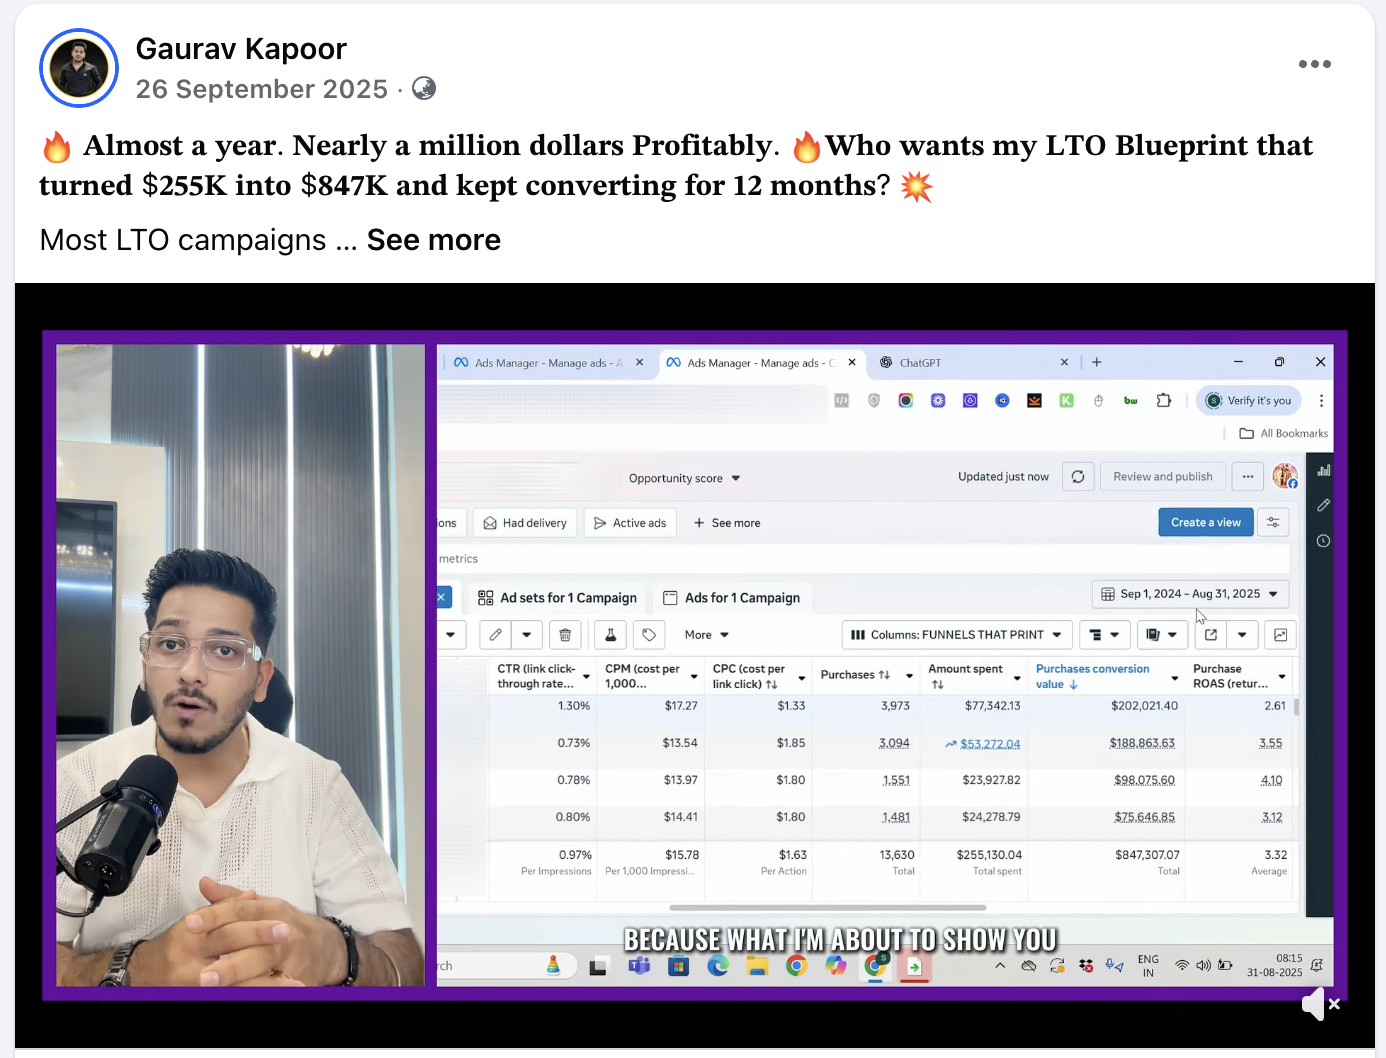
Founder of Funnels That Print. Since 2019 Gaurav has architected high-ticket and low-ticket acquisition funnels for coaching, consulting, home services, finance and DTC brands, including the $1.52M high-ticket consulting funnel and the $847K self-liquidating offer funnel documented on this site.
More from Gaurav ↗